The 12 SaaS Metrics That Actually Matter in 2026

Maya Lim
CTO
10 min read

There are hundreds of SaaS metrics you could track. These are the twelve that investors, operators, and boards actually use to evaluate business.
Vanity metrics are expensive. Teams that optimize for page views, registered users, or gross revenue without understanding what's actually driving business health make systematically worse decisions and find out too late.
This guide cuts to the twelve metrics that professional operators and investors use to read a SaaS business, with the formulas, benchmarks, and common misreads for each. For MRR decomposition in particular, our deep dive into understanding your MRR waterfall pairs directly with this post.
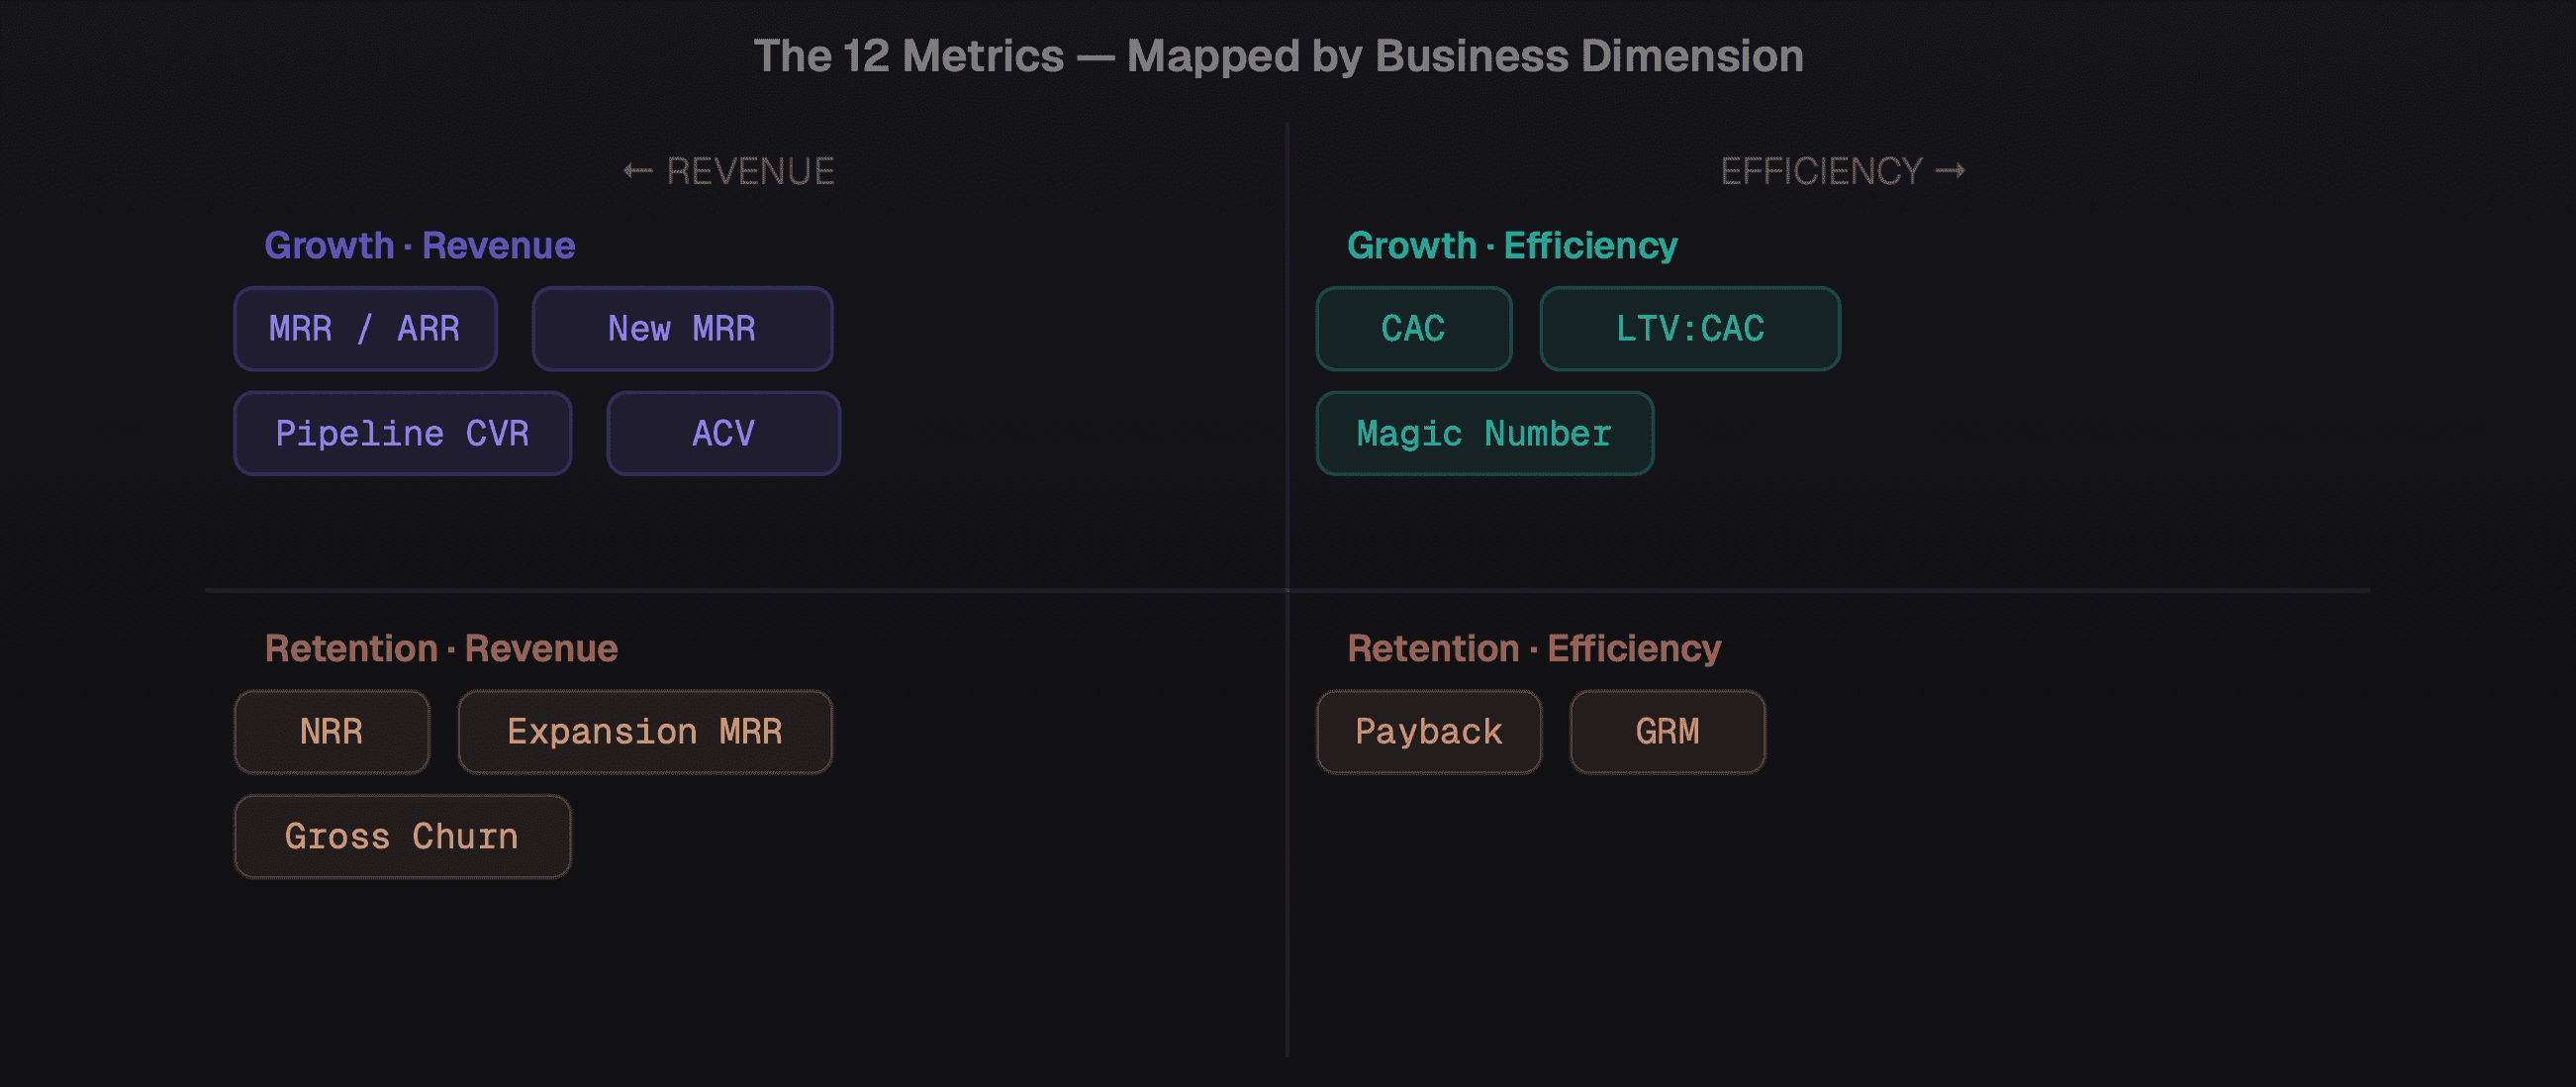
The 12 core SaaS metrics are mapped across Growth/Retention and Revenue/Efficiency dimensions.
Revenue metrics
The 4 revenue metrics
MRR / ARR
MRR = Σ (active customer monthly contract value)
Your single most important revenue signal. Track as a waterfall (New, Expansion, Contraction, Churn, Reactivation) — not as a single number. A flat MRR can hide a collapsing retention base offset by aggressive new sales. See our full guide on the MRR waterfall for decomposition methodology.
✓ Healthy: MoM growth ≥10% in growth phase
Net Revenue Retention (NRR)
NRR = (Start MRR + Expansion − Contraction − Churn) ÷ Start MRR × 100
The single metric most predictive of long-term enterprise value. An NRR above 100% means your existing customer base grows even if you sign zero new customers. World-class: >120%. Good: 105–120%. Danger: <90%. This is the metric investors scrutinise most in Series B+ due diligence.
✓ World-class: NRR >120% | Good: 105–120%
Gross Revenue Churn (GRC)
GRC = Churned MRR ÷ Starting MRR × 100
What percentage of your revenue base cancels each month? Critically: do not confuse gross churn with net churn. A company with 3% gross churn and 4% expansion MRR has negative net churn revenue and is growing despite the losses. Track both. The six leading indicators of gross churn are covered in our post on churn signals in your data.
✓ Good: <1% MRR gross churn monthly
Average Contract Value (ACV)
ACV = Total ARR ÷ Number of active contracts
ACV tells you where your product lives in the market. Sub-$5k ACV is self-serve. $5k–$50k is SMB-to-mid-market. Above $50k is enterprise. ACV trajectory is as important as the number itself, is it going up (up-market motion working) or down (price compression, market saturation)?
✓ Track trend direction, not just absolute value
Efficiency metrics
Customer Acquisition Cost (CAC)
CAC = Total S&M spend ÷ New customers acquired (same period)
The most commonly miscalculated metric in SaaS. Include full-loaded costs: salaries, commissions, tools, agency fees, and events. Blended CAC hides channel efficiency, always segment by acquisition channel. Your best channel's CAC may be 5× better than your worst, which has huge capital allocation implications.
✓ Segment by channel; never use blended alone
LTV: CAC Ratio
LTV = ARPU × Gross Margin % ÷ Monthly Churn Rate
The ratio of customer lifetime value to acquisition cost. The classic benchmark is 3:1 minimum; 5:1 is excellent; above 8:1 may signal under-investment in growth. The trap: LTV is highly sensitive to assumed churn rate. Model it with your actual cohort retention data, not aggregate churn, it will be meaningfully different.
✓ Target: LTV:CAC ≥3:1 | Excellence: ≥5:1
CAC Payback Period
Payback = CAC ÷ (ARPU × Gross Margin %)
How many months until a new customer pays back their acquisition cost? This is the most operationally useful efficiency metric, which determines how much capital you need to sustain a given growth rate. In a zero-rate environment, 24 months was acceptable. In 2026's capital environment, sub-18 months is the target.
✓ Target: <18 months | Good: <24 months
Sales Efficiency / Magic Number
Magic Number = Net New ARR ÷ Prior Quarter S&M Spend
For every dollar of sales and marketing spend, how many dollars of net new ARR do you generate? Above 0.75 is good. Above 1.0 means you should be investing more aggressively. Below 0.5 signals a go-to-market problem; adding more budget will not fix it.
✓ Good: >0.75 | Invest aggressively: >1.0
Retention and product metrics
Gross Margin
GM = (Revenue − COGS) ÷ Revenue × 100
SaaS gross margins should be 70–85%+. Below 60% usually signals excessive infrastructure costs, professional services embedded in the product, or a service business masquerading as software. Gross margin is the foundation of every LTV calculation; if it's wrong, everything downstream is wrong.
✓ Target: 70–85%+ for pure SaaS
Expansion MRR Rate
Expansion Rate = Expansion MRR ÷ Starting MRR × 100
What percentage of your starting MRR is growing through upsell and cross-sell? This is your PLG efficiency signal. Companies with strong expansion (15%+ monthly) can sustain growth with less new customer acquisition. Companies with flat or negative expansion are entirely dependent on the acquisition treadmill.
✓ Target: ≥15% of starting MRR monthly
Pipeline Conversion Rate
CVR = Deals Won ÷ Total Deals Entered Pipe × 100
Conversion rate by stage tells you where deals die and why. A high lead-to-opportunity CVR with a low opportunity-to-close CVR means your qualification is weak. High overall CVR with long sales cycles usually means your AE is cherry-picking deals. Track CVR by segment, AE, and channel separately; blended CVR hides everything interesting.
✓ Track by stage, AE, and channel — not blended
Time to Value (TTV)
TTV = Time from contract sign to first meaningful outcome achieved
Underrated and under-tracked. TTV predicts retention better than almost any other early signal. Customers who reach their first meaningful outcome within 7 days retain at 2× the rate of those who take 30+ days. Fast TTV also reduces the CAC payback period indirectly by lowering early churn. For automation strategies that accelerate TTV, see our post on what to automate first.
✓ Target: <7 days to first meaningful outcome
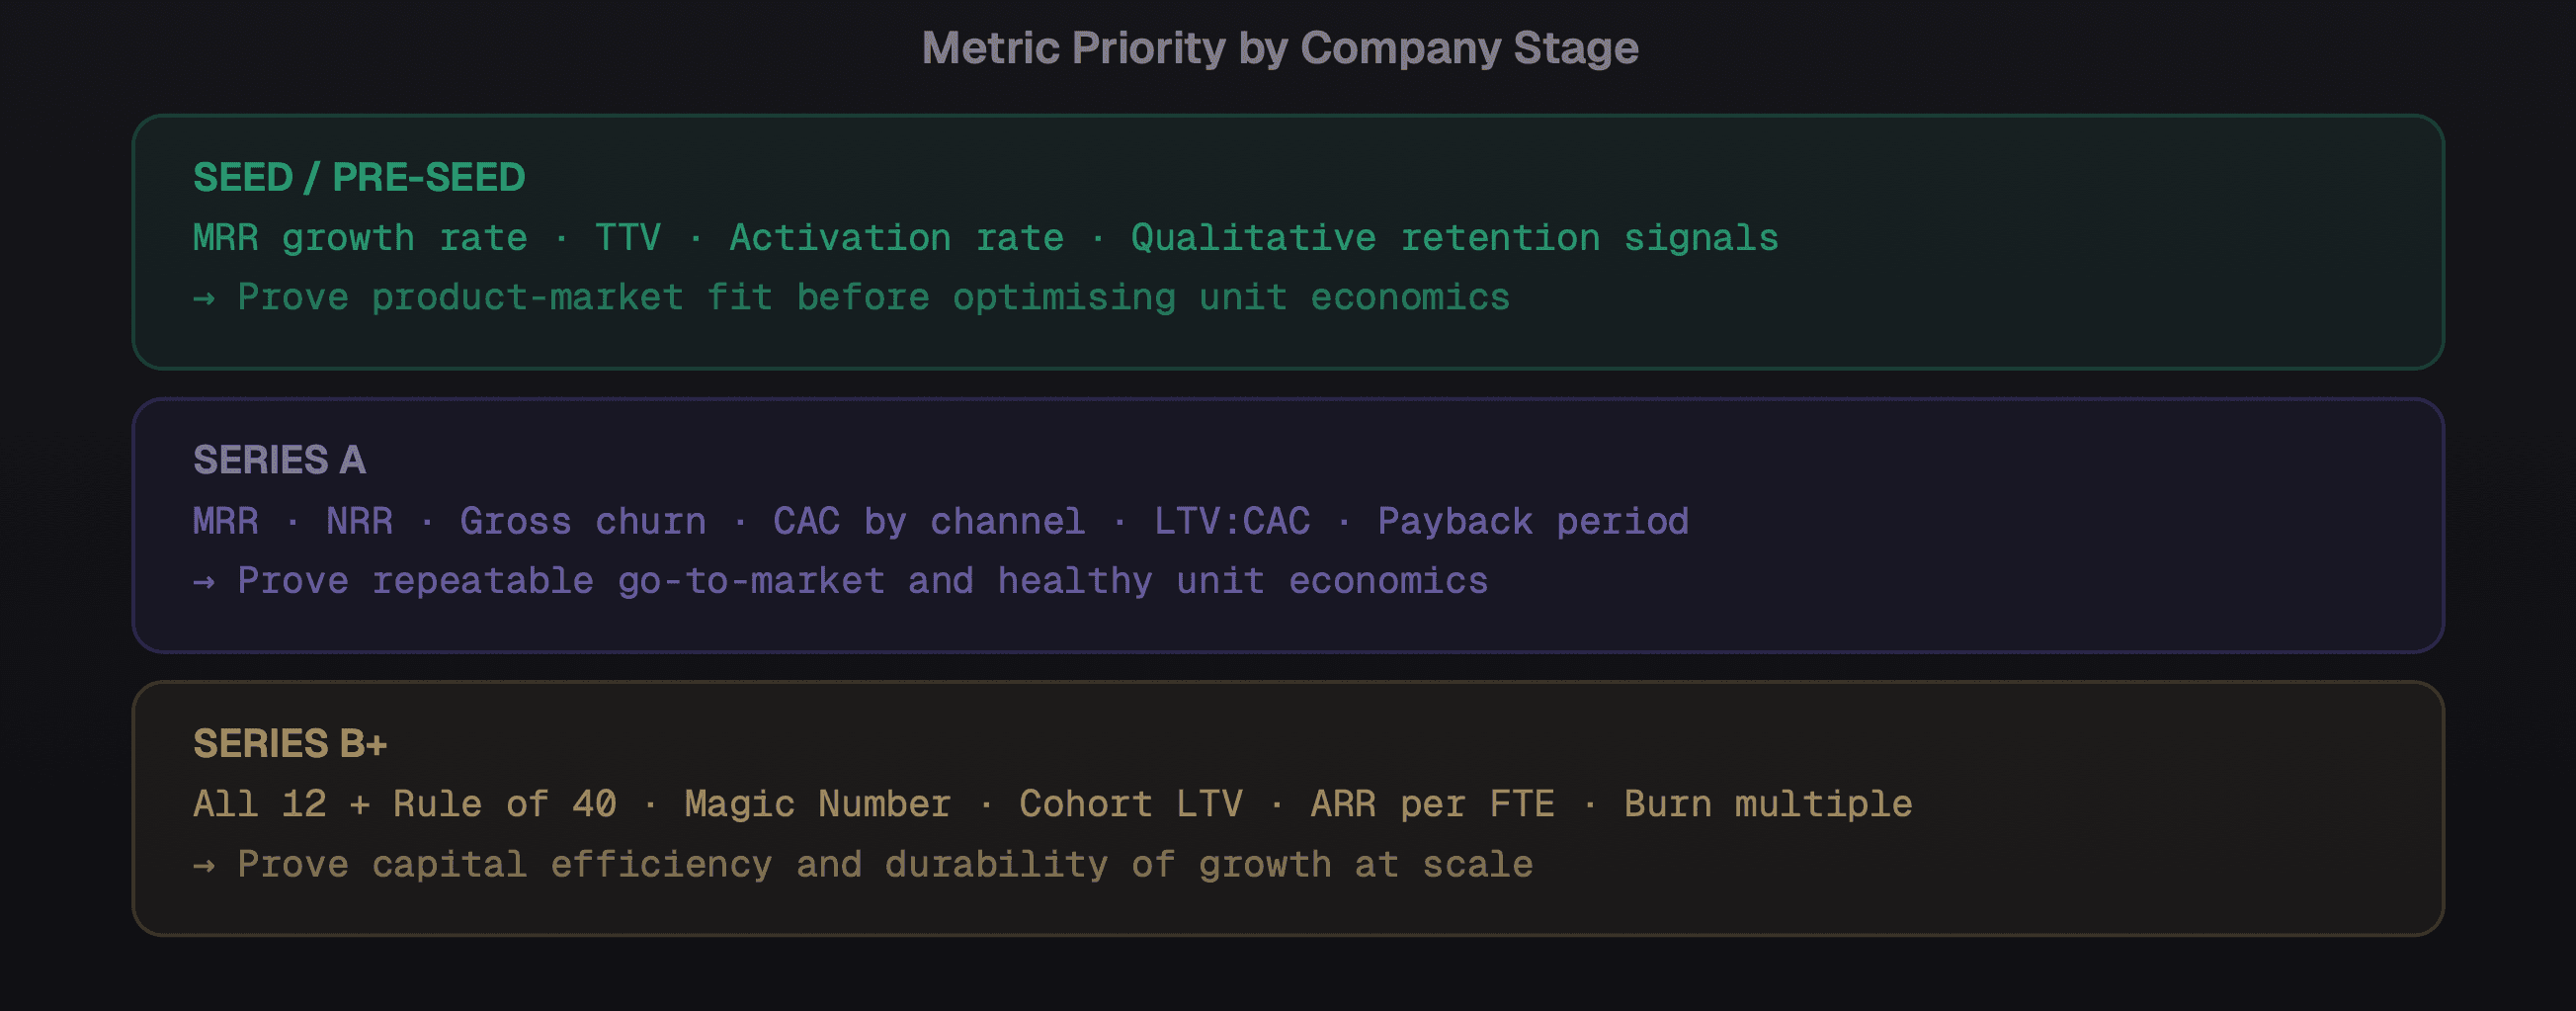
Which metrics to prioritise at each company stage — tracking all 12 too early creates measurement overhead without decision value.
The three most commonly misread metrics
MRR growth rate without waterfall decomposition. A team celebrating 15% MoM MRR growth may be masking a retention crisis if gross churn is 8% and new sales are carrying the number, you're on a treadmill that gets faster every month.
Always decompose. See the full waterfall methodology in our MRR waterfall guide.
NRR using billing dates instead of cohort dates. If you calculate NRR using calendar months rather than anchoring to each cohort's start date, you get a systematically optimistic number that doesn't reflect true retention.
Use cohort-anchored NRR our post on cohort retention analysis covers this in depth.
CAC without including all costs. The most common error: calculating CAC using only quota-carrying rep salaries, excluding SDR costs, marketing spend, tools, events, and management overhead.
This underestimates true CAC by 40–60% in most teams. Use fully-loaded CAC, always.
Twelve metrics is all you need. Track fewer and you'll miss critical signals; track more and you'll create measurement overhead that consumes more value than the insight delivers. Master these twelve and you'll understand any SaaS business well enough to run it.
These twelve metrics don't operate in isolation they form a system. Optimize one without understanding its relationships to the others and you'll create problems elsewhere.
For the tooling and automation that makes tracking all twelve feasible without a dedicated analytics team, see how Nexus's revenue intelligence module connects directly to your billing system and surfaces these metrics automatically.


