Understanding Your MRR Waterfall: A Complete Guide

Sofia Chen
CFO
7 min read

MRR is one number that tells many stories. Learn how to decompose, read, and act on every component of your Monthly Recurring Revenue.
Every SaaS board meeting covers MRR. But most teams report it as a single number total MRR this month vs last month and miss 90% of the signal. The waterfall is where the real story lives.
MRR isn't just a metric. It's a diagnostic tool. When you decompose it correctly, you can see exactly which growth levers are working, which retention problems are compounding, and where your next dollar of investment will generate the highest return. This is one of the core metrics covered in our broader guide to the 12 SaaS metrics that actually matter.
The five components of MRR movement
New MRR
Revenue from customers who were not paying anything last month and are now on a paid plan. This is the purest acquisition signal. New MRR is almost entirely driven by sales and marketing performance it reflects the efficiency of your top-of-funnel, conversion rate, and ACV of new deals.
Benchmark: healthy SaaS companies at your stage should see New MRR growing at 10–15% month-over-month in their growth phase.
Expansion MRR
Revenue from existing customers who upgraded, bought more seats, or added modules. This is your most efficient growth lever customers who expand have already bought in to your value proposition. Expansion MRR costs a fraction of new customer acquisition to generate.
When Expansion MRR exceeds Churn MRR, you achieve negative net revenue churn meaning your revenue base grows even if you never sign another new customer. This is the holy grail of SaaS economics.
Contraction MRR
Revenue lost from existing customers who downgraded fewer seats, lower tier, reduced usage. This is different from churn: the customer is still paying, but paying less. Contraction often predicts churn by 2–3 months.
A customer who moves from Pro to Starter is showing you they've decided your product isn't worth what they were paying.
The intervention here is a value conversation, not a discount. Discounting contraction usually just accelerates the eventual churn.
Churned MRR
Revenue lost from customers who cancelled entirely. This is the most visible component of the waterfall and gets the most attention but it's often the symptom, not the problem.
The problem usually appears 6–8 weeks earlier as usage drop or feature abandonment (see our post on the 6 churn signals hiding in your data). If you're reacting to churn, you're already late.
Reactivation MRR
Revenue from customers who previously churned and returned. Often overlooked, this component signals product-market fit more strongly than new customer acquisition: a customer who left, tried alternatives, and came back is your most credible reference. High reactivation rates (above 15% of churned customers within 12 months) are a strong indicator that your core product has no real substitute in the market.
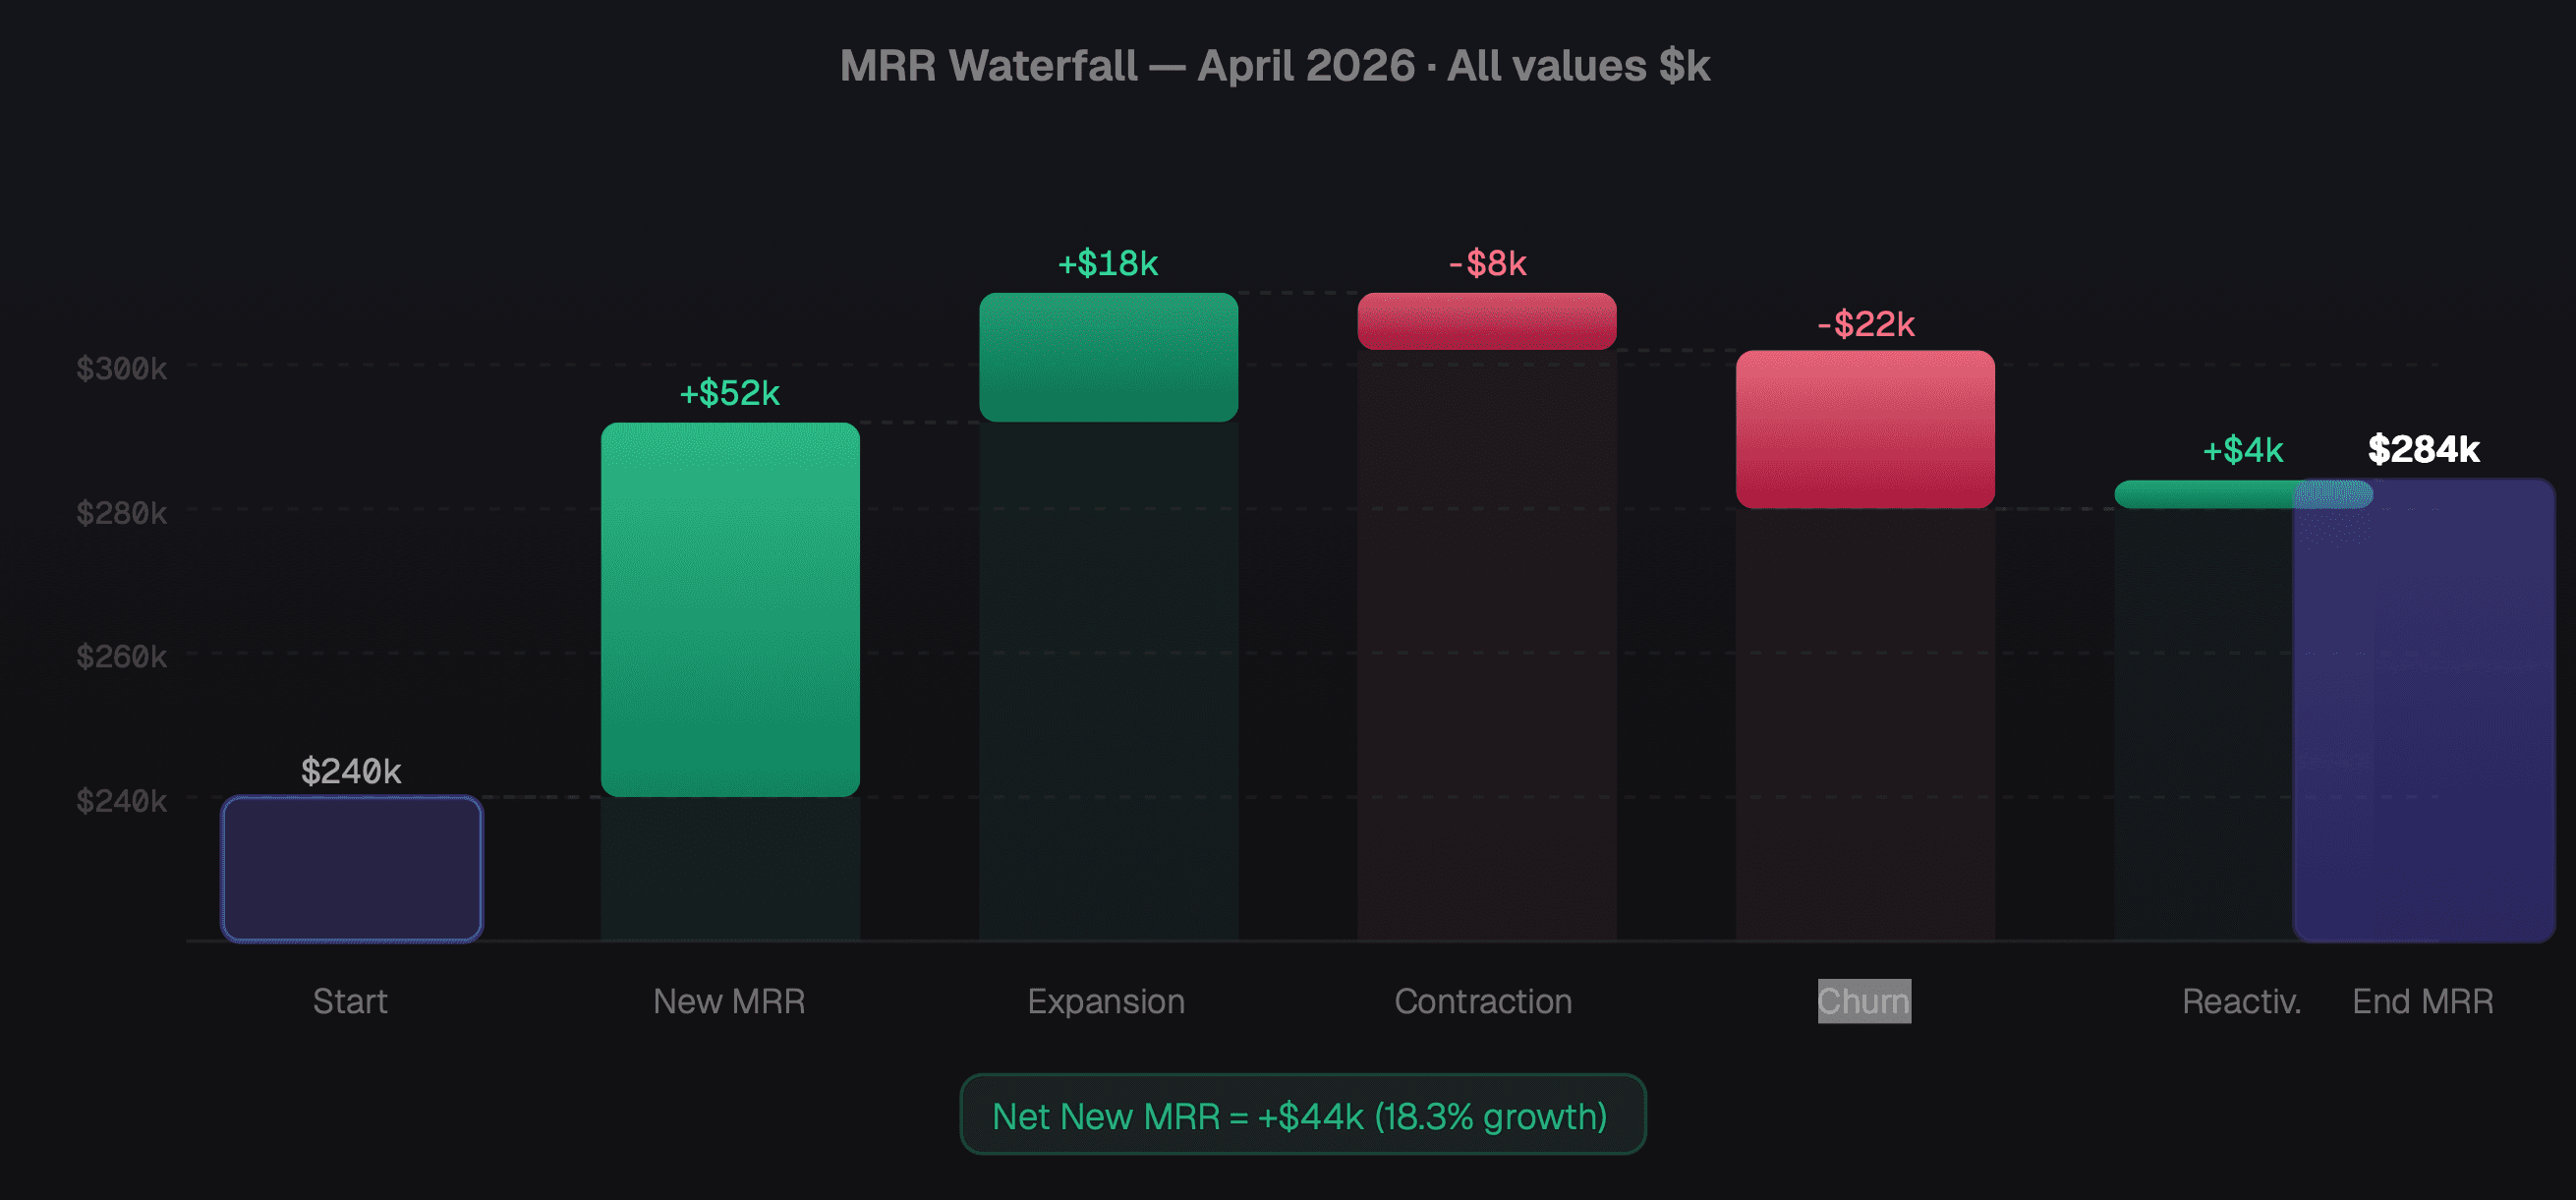
MRR waterfall bridge chart — every dollar of movement, source identified
Reading the waterfall: what healthy looks like
A healthy waterfall tells a specific story. Here are the ratios that distinguish excellent from average:
Expansion MRR ≥ 30% of New MRR. This means your existing customers are growing into your product. Below 20% signals a land-and-don't-expand problem your onboarding or product depth isn't creating upsell motion.
Net Revenue Churn ≤ 0%. If Expansion MRR exceeds Churn + Contraction MRR combined, you have negative net churn. Your revenue base grows without any new customers. This is the benchmark elite SaaS companies hit.
Churn MRR ≤ 1.5% of starting MRR per month. Annualized, this is 18% gross revenue churn the upper boundary of "acceptable." Below 1% monthly (12% annual) is excellent. Above 2% monthly (24% annual) is existential at scale.
Reactivation MRR ≥ 10% of Churn MRR. If you're not winning back any churned customers, you're not learning why they left or not improving fast enough to matter.
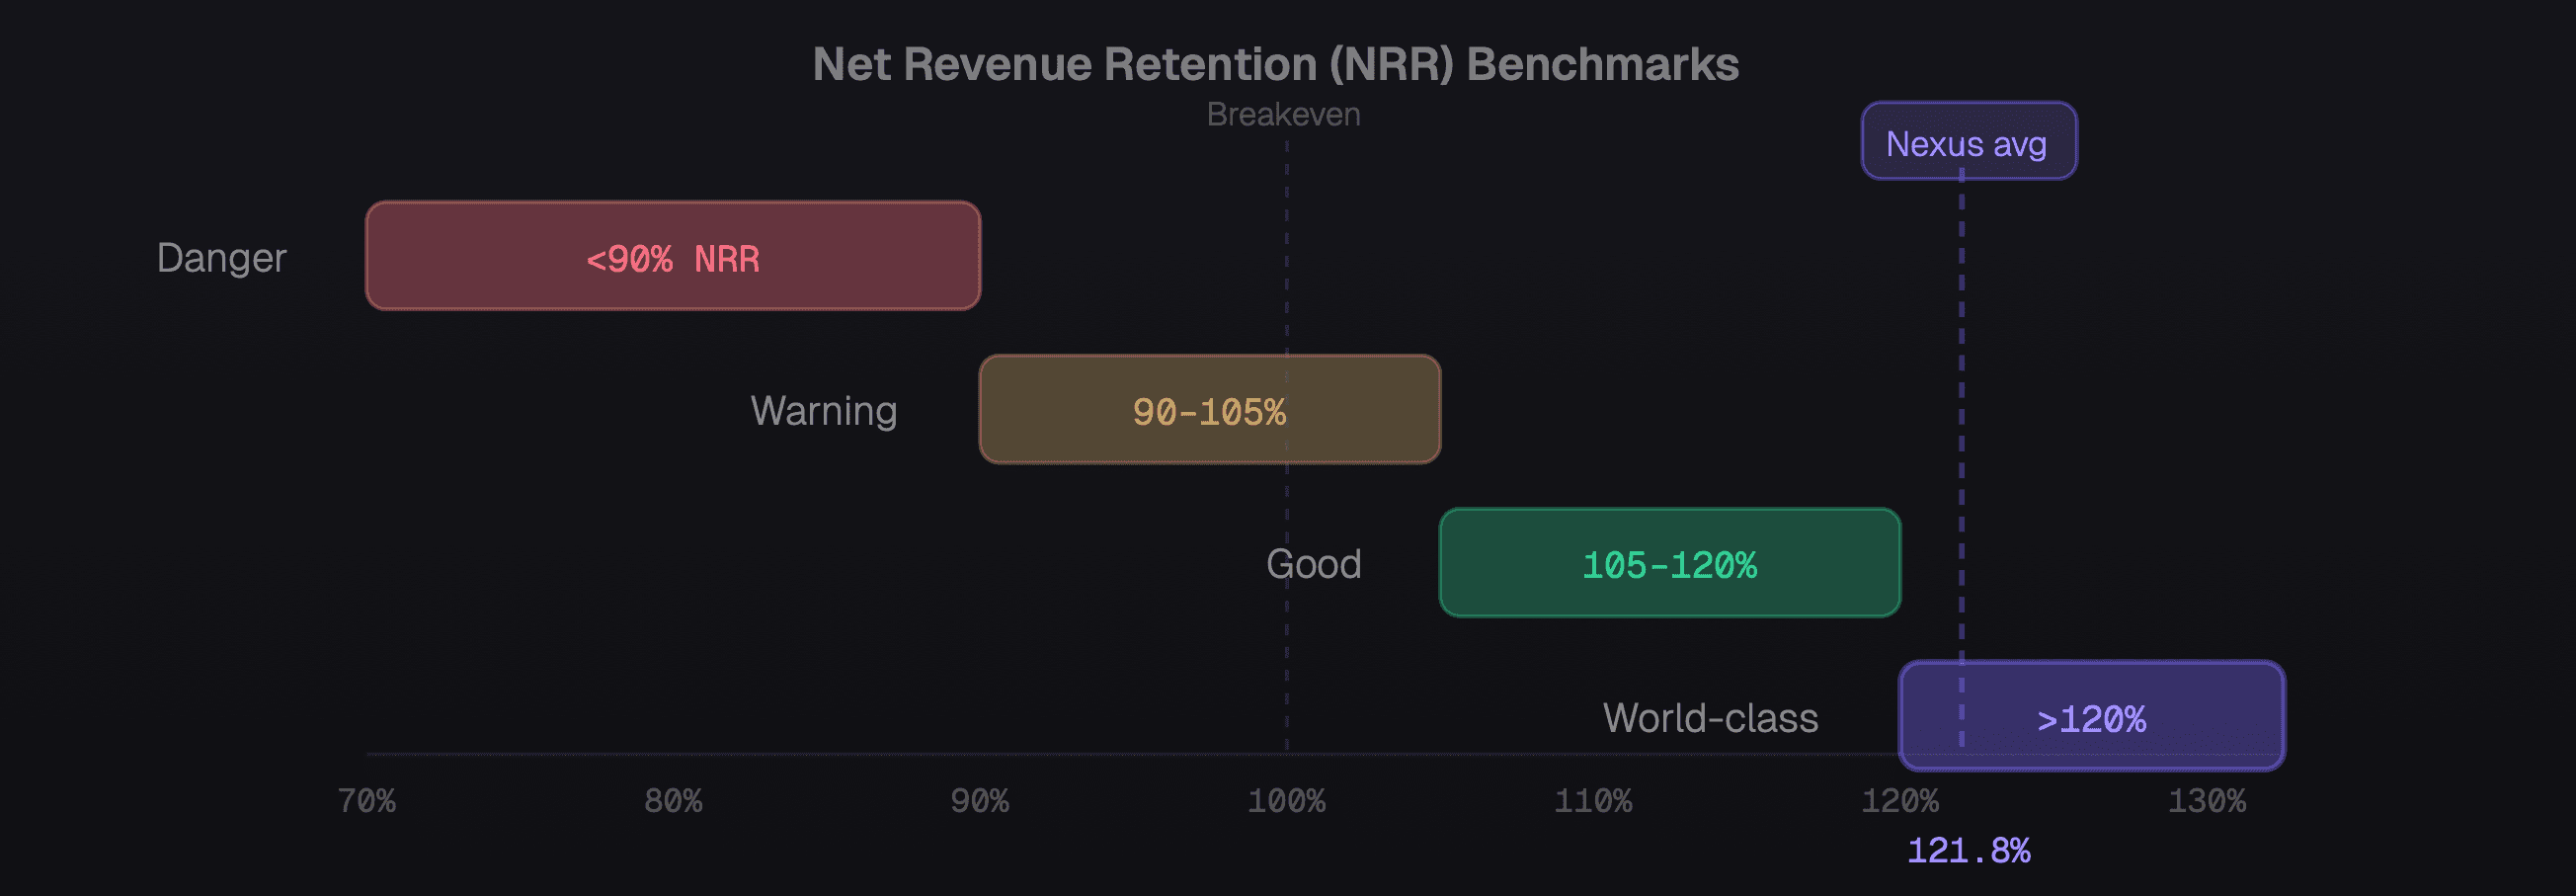
NRR benchmark tiers — where your retention stacks up and what it signals to investors
Building your waterfall reporting
The waterfall only generates value if you review it consistently ideally monthly with your leadership team, weekly in early-stage. Here's the stack:
Data source: Your billing system (Stripe, Chargebee, or similar) is the ground truth. Every customer's MRR change is logged at the transaction level. Don't manually categorize build classification rules.
Classification logic: New = zero to any MRR. Expansion = existing customer MRR increase. Contraction = existing customer MRR decrease. Churned = any MRR to zero. Reactivation = zero to any MRR, where the customer had MRR before. These rules handle 95% of cases automatically.
Frequency: Calculate on a monthly basis, but track weekly leading indicators (new pilots started, NPS scores, usage trends) that predict next month's waterfall movement.
Visualization: The waterfall bridge chart (as above) is the clearest format. Build it in Looker, Metabase, or Nexus's analytics module. Share it in every leadership review not as a slide, but as a live dashboard with drill-down capability.
The four levers to move your waterfall
Once you can read the waterfall, you have four levers:
Lever 1: Grow New MRR. Classic go-to-market: more pipeline, better conversion, higher ACV. Every SaaS CEO knows this lever. The mistake is pulling only this one.
Lever 2: Accelerate Expansion. Product-led expansion (usage limits, feature gates, seat limits) creates natural expansion triggers. Sales-led expansion requires CSMs with clear playbooks and incentive structures that reward NRR, not just ARR.
Lever 3: Reduce Contraction. Build downgrade friction (but not so much that you prevent honest rightsizing). When a customer tries to downgrade, trigger an immediate save conversation not an automated email, but a human call within 24 hours. Understand why before you make any offer.
Lever 4: Prevent Churn. The most powerful lever, because retention compounds. A 1% improvement in monthly retention is worth more than a 15% improvement in new customer acquisition at scale. This connects directly to the proactive churn prediction system described in our post on the 6 churn signals hiding in your data.
The companies that build truly durable revenue machines don't just acquire fast — they retain well. Net Revenue Retention above 120% means your existing customer base alone grows your company, quarter after quarter, regardless of your acquisition pace.


