The 6 Churn Signals Hiding in Your Data Right Now

Sofia Chen
CFO
6 min read

Before customers cancel, they telegraph their exit across your product, billing, and support data. Here's exactly what to look for.
Churn is rarely a surprise to the data. It is almost always a surprise to the team. That gap between what the numbers say and what humans hear is where most SaaS revenue gets quietly lost.
After analyzing retention patterns across thousands of accounts on the Nexus platform, we've identified six leading indicators that appear consistently and measurably in the weeks before a cancellation. None of them requires predictive ML to spot. They require someone or something to be watching.
This post walks through each signal, what it means mechanically, and the intervention protocol that actually moves the needle. For a wider view of the revenue metrics framework these signals slot into, see our post on the 12 SaaS metrics that actually matter.
Why lagging indicators fail you
Most teams track churn as a lagging indicator: a customer cancels, it shows up in the MRR waterfall, and someone flags it in a review. By then, you've already lost them. The intervention window typically 4–8 weeks before cancellation is gone.
The shift that matters is moving from tracking what happened to watching what's about to happen. All six signals below are observable before the cancellation event. Most can be detected automatically. All of them are actionable.
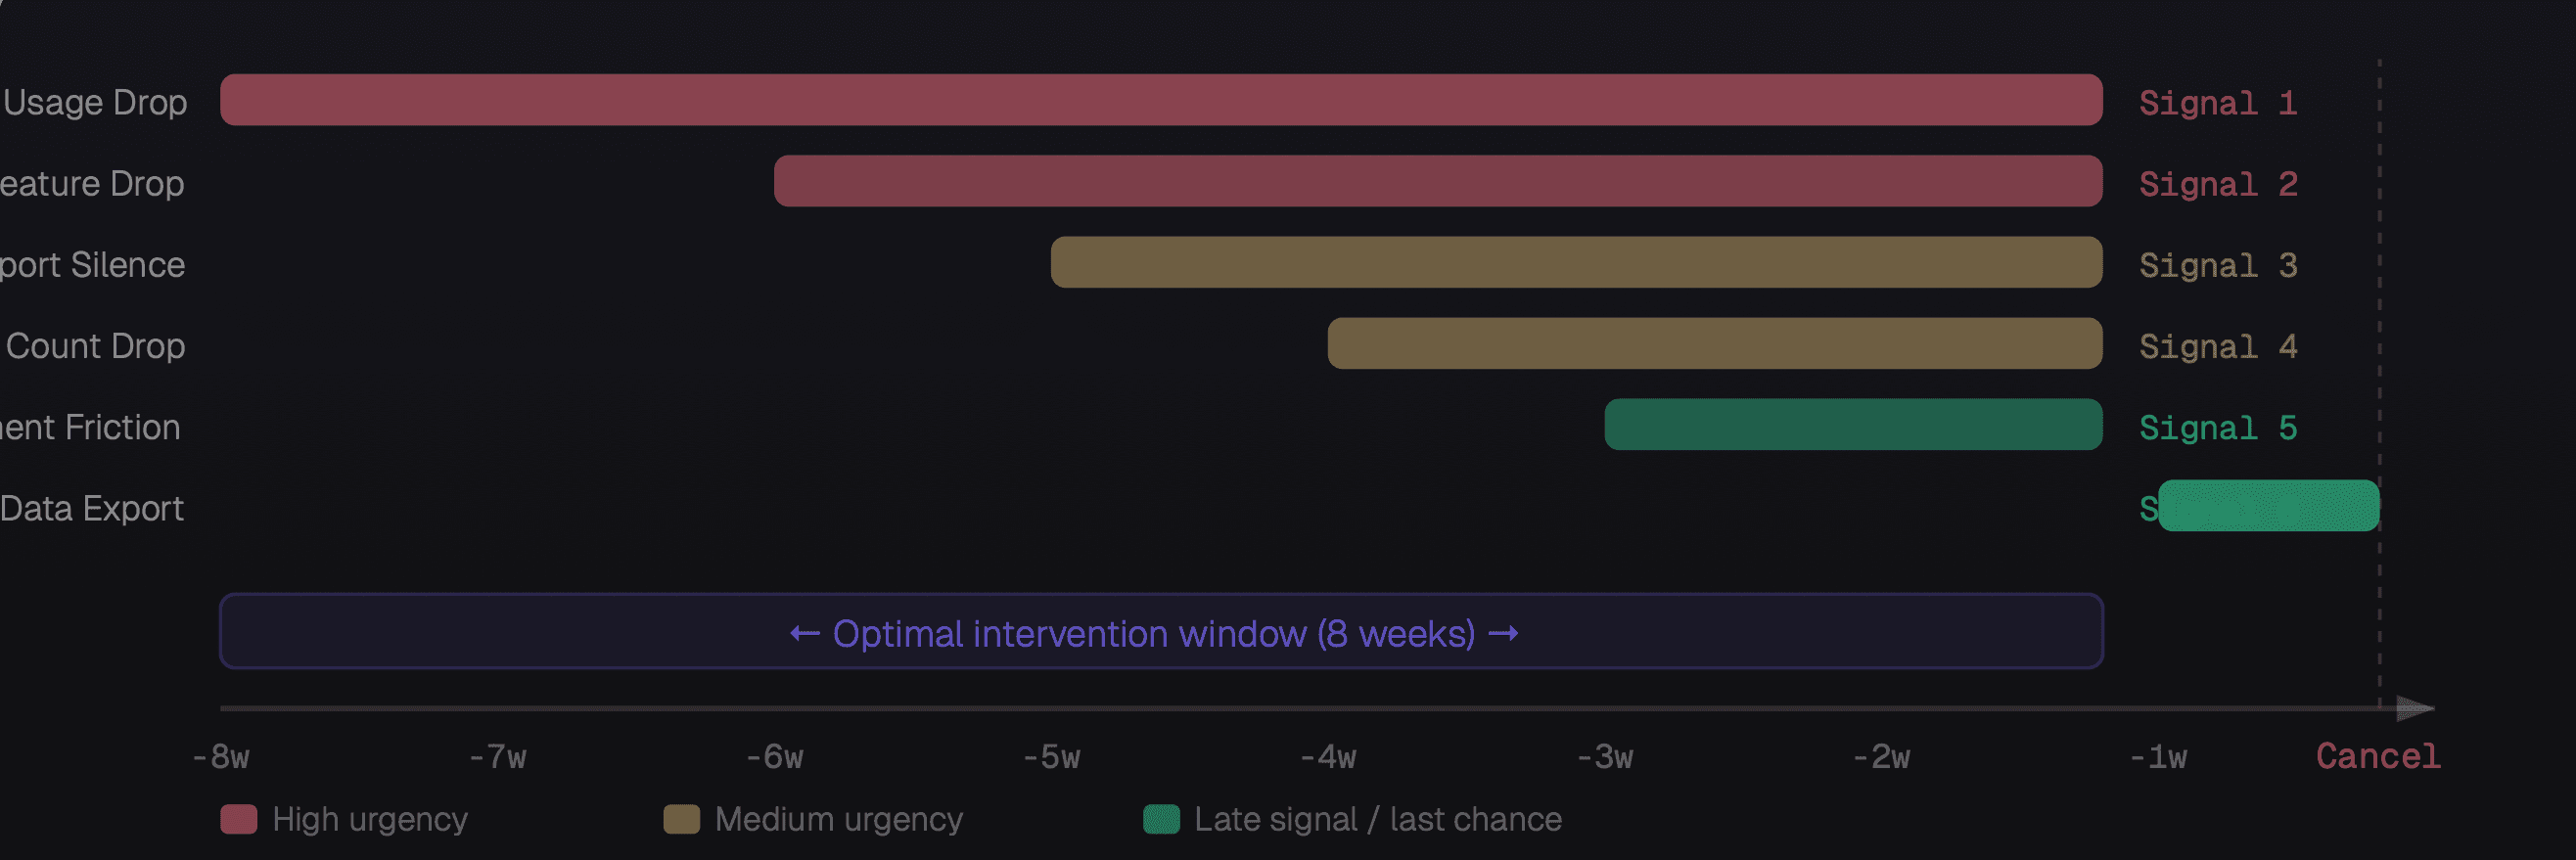
When each churn signal appears relative to cancellation, and your intervention window
The six signals
Weekly active usage drops more than 40%
This is the most reliable early signal and it typically appears 6–8 weeks before cancellation. A customer who logged in daily starts logging in twice a week. A team that ran 50 automations a week is now running 12. The product has slipped from "essential" to "optional" in their mental model. The fastest intervention is a usage-triggered check-in from the CSM with a personalized usage report and a "what changed?" question.
Abandonment of previously used core features
Different from general usage drop. This is about specific features going dark. A team stops using your reporting module, or stops creating new workflows, or stops adding integrations. Feature abandonment often precedes general disengagement by 2–3 weeks. It also tells you why they're losing interest: the abandoned feature is usually the one they complained about in support or didn't fully adopt. Address the specific feature, not the general relationship.
Support ticket volume drops to zero
Counterintuitively, silence is more alarming than complaints. Customers who complain are still trying they want the product to work. A customer who stops submitting tickets after a history of engagement has usually already decided to leave. They've given up trying to fix it. They're using the product on autopilot, waiting for their contract to expire. Proactive outreach here especially, a direct call from a senior person dramatically outperforms email.
Seat count declines without explanation
In B2B SaaS, when an account removes users, they're not just offboarding a person who left they're reducing their organizational footprint. Three or more deactivated seats in a 30-day window, without a corresponding support request explaining why, is a consolidation signal. The account is deciding how much of your product they actually need. The intervention is an expansion conversation, not a retention conversation ask what they're solving for and show a path to right-sizing.
Failed payment attempts without resolution
One failed payment is usually an expired card. Two failed payments with no update means the customer hasn't prioritized fixing it — which is itself a signal. By the third attempt, you're in churn territory. The nuance: enterprise accounts rarely churn due to payment failure (AP teams sort this out). This signal is disproportionately meaningful for SMB and self-serve accounts where the primary stakeholder is also the billing owner.
Data export activity spikes
This is your last-chance signal appearing 1–2 weeks before cancellation. When a customer exports their data (CSVs, API bulk reads, integration disconnection), they're preparing to move. It doesn't mean they've decided, sometimes it's just a backup. But combined with any of signals 1–5, it's a near-certain churn indicator. This is the moment for an executive-to-executive call, not a CSM email. You need decision-maker access and a meaningful offer.
Building your churn detection system
The six signals above are only useful if someone, or something is watching for them continuously. Manually checking every account every week isn't scalable. You need an automated detection layer.
The architecture is simpler than it sounds:
Define your signal thresholds for each of the six signals, calibrated to your product's usage patterns.
Build detection rules that fire when thresholds are crossed. Most modern data warehouses (BigQuery, Snowflake) can run these as scheduled queries.
Create a health score that aggregates the signals. A customer with signals 1 and 3 active is at higher risk than one with only signal 5. Weight accordingly.
Route alerts automatically to the responsible CSM or ops team with a pre-populated intervention brief — account history, the specific signal, and a suggested action.
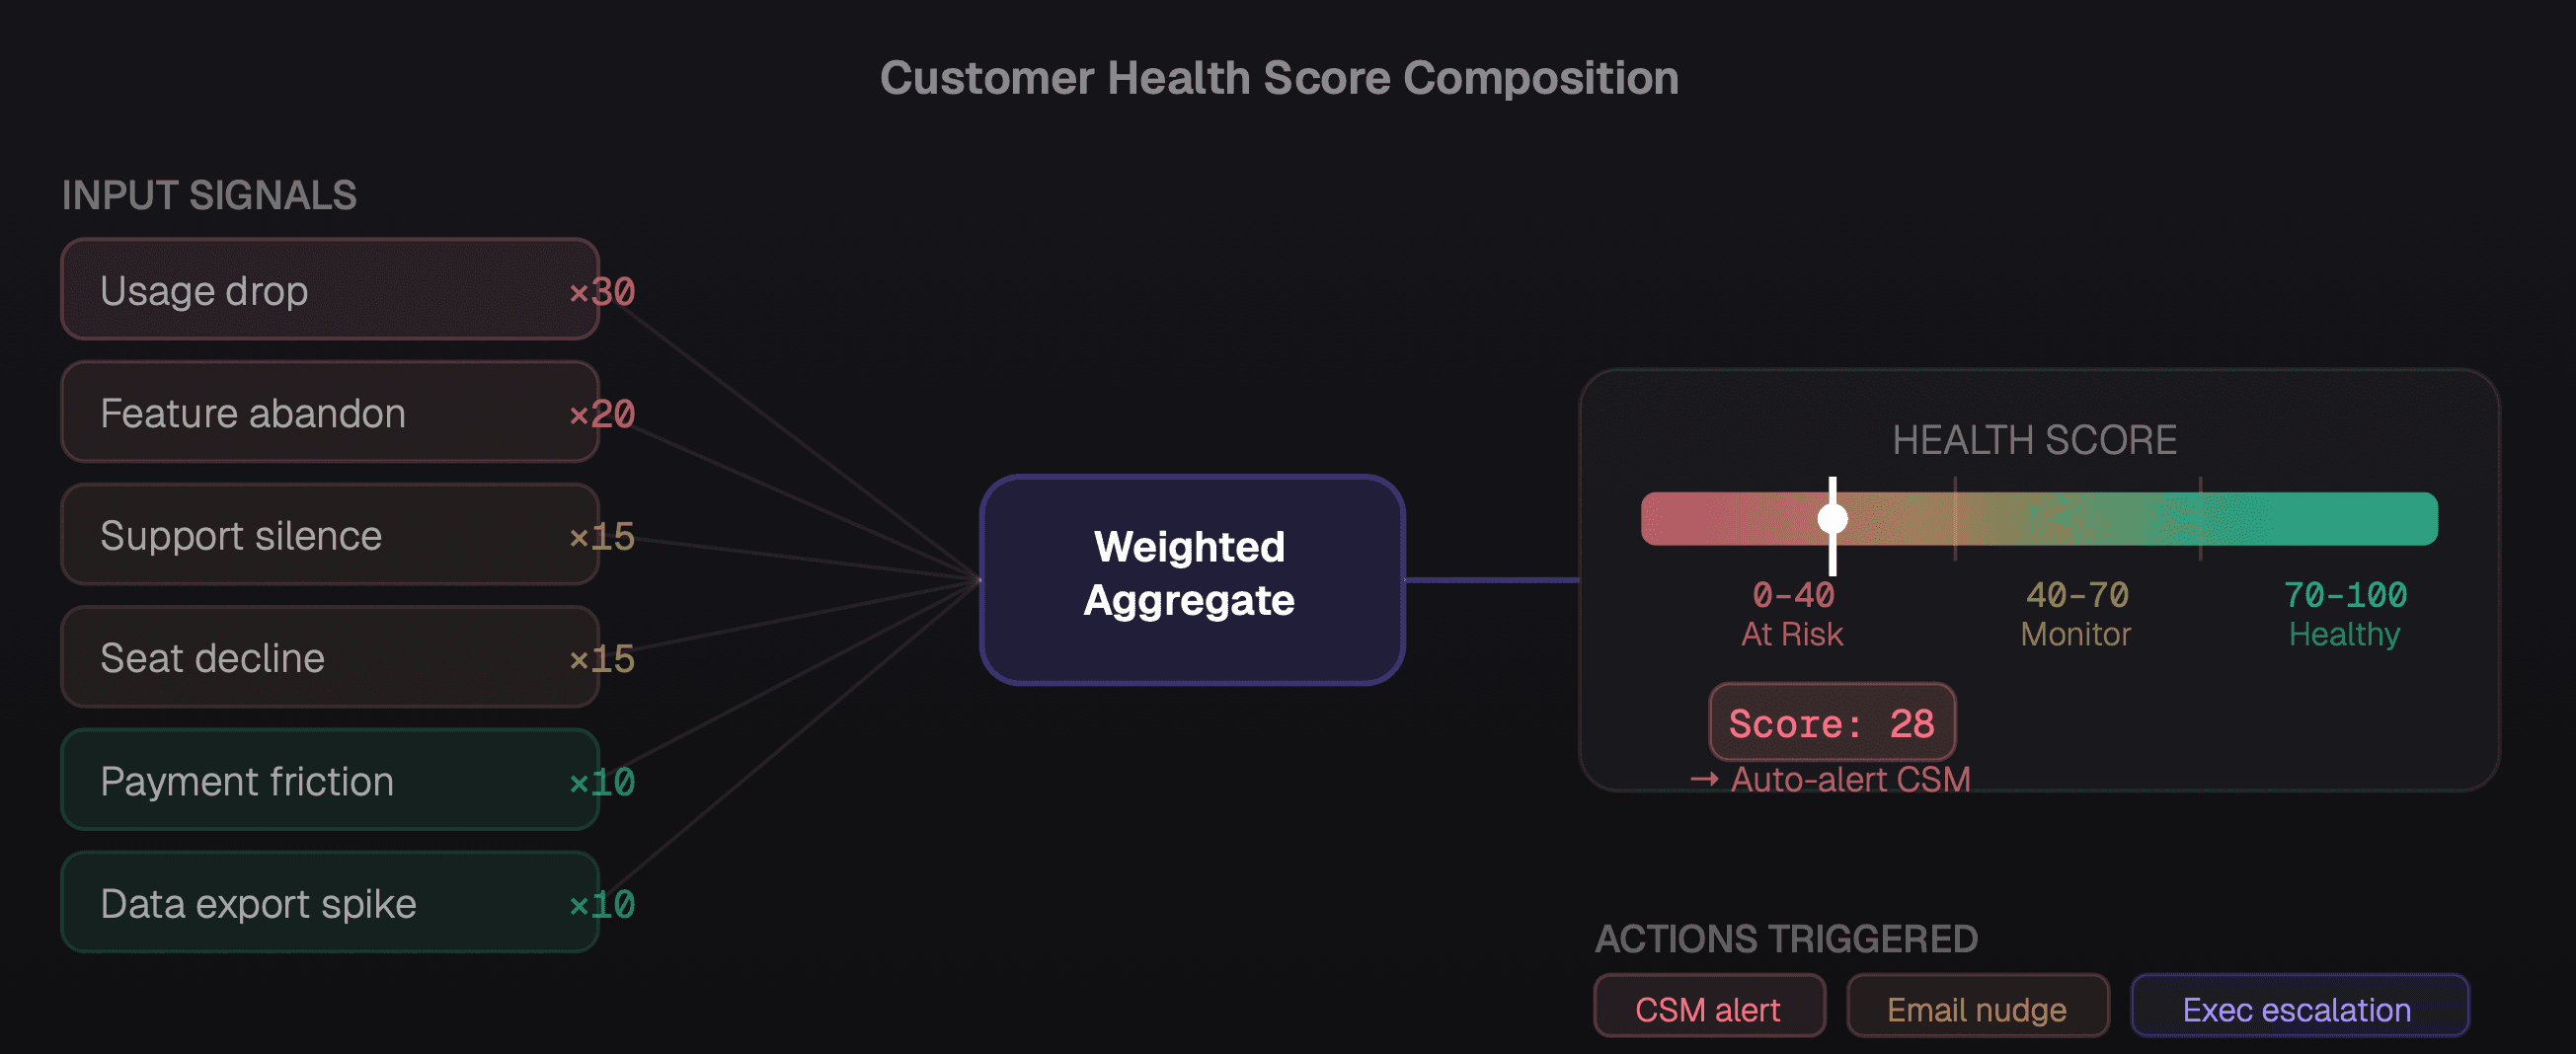
How six churn signals combine into a weighted health score that drives automatic intervention routing
The intervention playbook
Detection without intervention is just a more sophisticated way to watch customers leave. Here's the playbook that actually works:
Signals 1–2 (usage and feature drop): CSM-led usage review. Share a personalized usage report. Ask two questions: "What changed in how your team is using the product?" and "What problem were you trying to solve that you haven't solved yet?" Don't pitch. Listen.
Signal 3 (support silence): Direct outreach from a senior person, ideally VP or C-level. Frame it as a check-in, not a retention call. "We noticed you haven't needed our support team recently and wanted to make sure things are running smoothly." Response rate is dramatically higher than a CSM email.
Signals 4–5 (seat drop, payment friction): Combine into a single "account health" call. Address both practically — understand the seat change, offer to assist with billing resolution. Present a rightsizing option that shows you're thinking about their budget, not just yours.
Signal 6 (data export): This is your last chance. Get executive access. Understand the specific reason they're moving. If there's a fixable problem, commit to a timeline and put it in writing. If there isn't, understand the competitive displacement and use it to improve the product for everyone else.
For teams automating the detection and routing of these signals, our post on AI agents in business operations covers the infrastructure that makes this scalable — including how to build automated alert routing with full account context included. And for the broader metrics framework your health score sits within, see our guide to understanding your MRR waterfall.
The companies that win at retention aren't the ones with the best product — they're the ones with the best early warning systems. The data is already there. The question is whether anyone's reading it.
Churn prevention is ultimately a data literacy problem. These six signals exist in every SaaS product's data. They just need to be surfaced, scored, and routed to someone who can act on them, fast enough to matter.


